What is Volatility Framework ?
The Volatility Framework is a completely open collection of tools, implemented in Python under the GNU General Public License, for the extraction of digital artifacts from volatile memory (RAM) samples. The extraction techniques are performed completely independent of the system being investigated but offer unprecedented visibility into the runtime state of the system. The framework is intended to introduce people to the techniques and complexities associated with extracting digital artifacts from volatile memory samples and provide a platform for further work into this exciting area of research.
Volatility supports memory dumps from all major 32- and 64-bit Windows versions and service packs including XP, 2003 Server, Vista, Server 2008, Server 2008 R2, and Seven. Whether your memory dump is in raw format, a Microsoft crash dump, hibernation file, or virtual machine snapshot, Volatility is able to work with it. We also now support Linux memory dumps in raw or LiME format and include 35+ plugins for analyzing 32- and 64-bit Linux kernels from 2.6.11 - 3.5.x and distributions such as Debian, Ubuntu, OpenSuSE, Fedora, CentOS, and Mandrake. We support 38 versions of Mac OSX memory dumps from 10.5 to 10.8.3 Mountain Lion, both 32- and 64-bit. Android phones with ARM processors are also supported.
How to use Volatility Framework
Before you can conduct victim system analysis you need to capture memory.
Step 1: First Download dumpit or LiME and capture victim pc memory.(Dumpit for Windows and LiME is for Linux )
Step2: Download Volatility for windows PC from here
Step3: Now Open Volatility from command prompt and use Commands or else you can use our tool to analyze the Dump.
Volatility Memory forensics Tool – Volatility Command Centre
Here we are focusing on developing a GUI tool to help people who is using Linux Operating systems.
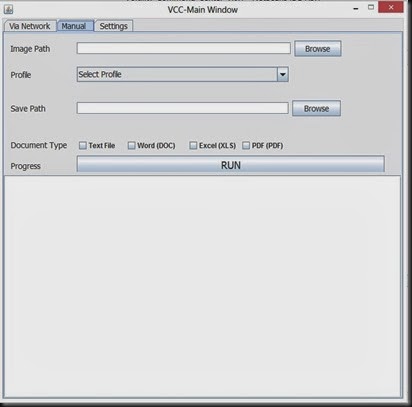
When you open the Infinity you will see the Volatility logo and then you will direct to the main window panel
Here you have two options. 1. Network , 2. Manual In both the ways you need to get the memory dump first from the PC and in Network mode, upload the dump from the infected PC or else in Manual mode u can upload the dump file by using this window.
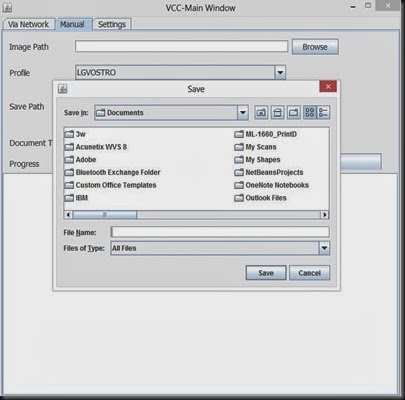
you can create a profile name and a set a location to keep a separate track on the dump files that you are analyzing.
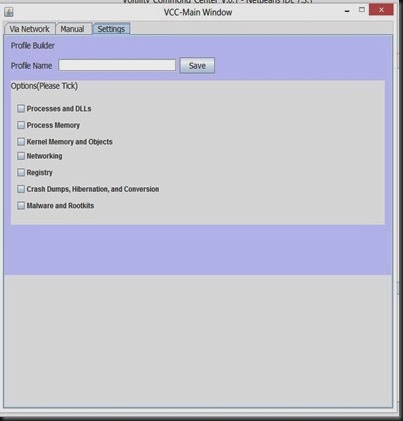
Here you have options to customize the output
Team Members
1.Nirmal Soysa
2.Shama Dilhari Gunaratne
3.Gayan Fernando
4.Hemal Ekanayake
Reference:
https://code.google.com/p/volatility/
http://www.forensicswiki.org/wiki/Volatility_Framework
http://code.google.com/p/volatility/wiki/LinuxMemoryForensics


